Measuring Economic Inequality
A side note on how economists look at inequality
A great deal of research shows that union wages are higher than nonunion wages. This is misleading for several reasons. Unionized workers are more skilled on average. They are more likely to be college graduates. They work in higher productivity industries that pay more whether or not workers join unions.
Careful research analyzes union and nonunion workers with comparable skills in the same industry, with common demographic characteristics. Adjusting for these composition effects, researchers find that unions benefit workers overall. They make the biggest difference to those with the fewest skills and lowest pay. (Whether these benefits are offset by higher unemployment rates as market devotees assert is an important question for another day).
Because unions reduce income inequality, I and many others have long held that weaker unions worsen income inequality. It might be true, but for the past ten years as the share of union workers has continued to shrink, bottom-quartile wages have grown faster than wages for better-paid groups.
In other words, as unions shrink, income inequality has been shrinking too. This is not necessarily a contradiction, but it is inconvenient. What is going on? Are unions necessary to reduce income inequality or not? Let’s take a closer look.
Wages at the Bottom Have Risen Faster Than at the Top
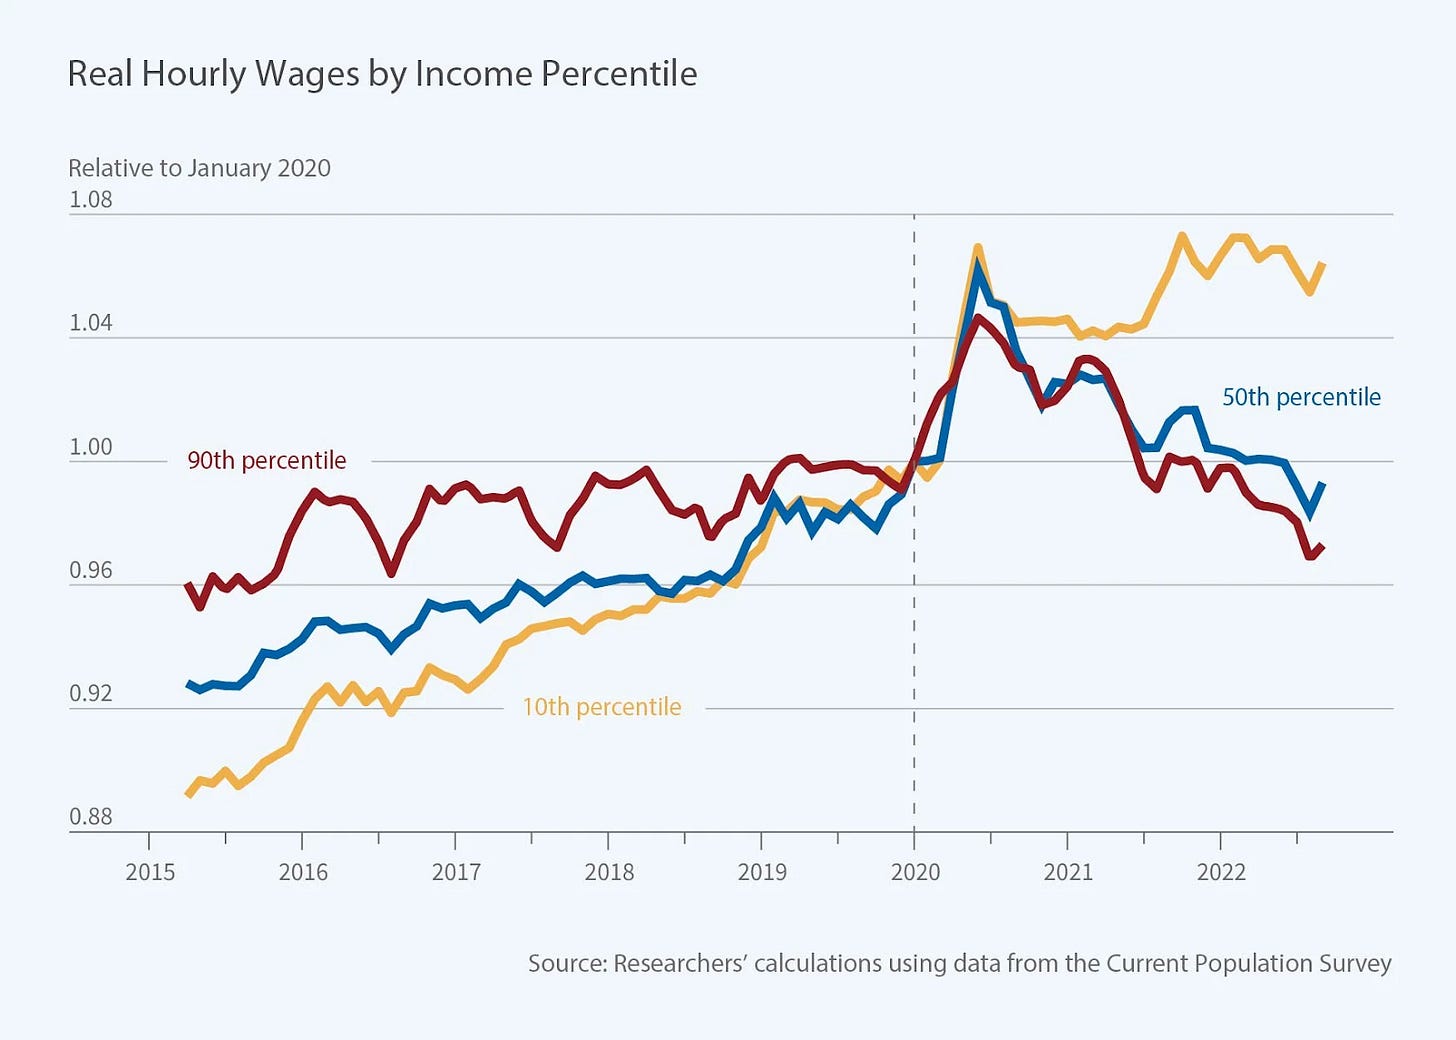
Two important studies conclude that the pandemic reduced income inequality by boosting the pay of low-wage workers. Economists David Autor, Arindrajit Dube, and Annie McGrew use monthly Current Population Survey datasets to document rising pay in the bottom decile of all workers compared with workers in the 50th and 90th deciles. Those concerned with income inequality cheered the results: pay compressed sharply during the pandemic.
Why? Were labor markets tighter because fewer people wanted to work or because labor-intensive businesses grew faster? Or did wages grow because some people changed to higher-paying jobs? In the first case, a tighter labor market would be a rising tide that lifted all boats: pay raises would be widespread. In the second case, pay raises would go mainly to people who changed jobs.
The researchers concluded that the gains went heavily to the job changers, especially younger workers, high school-educated workers, and workers in the service and hospitality industries. Tight labor markets reduced employer market power so these workers could move from lower-paying to higher-paying and potentially more productive jobs.
Economist Ernie Tedeschi attempted to extend this analysis back before the pandemic to determine whether workers are better off today than they used to be. Tedeschi served until earlier this year as Biden’s Chief Economist at the White House Council of Economic Advisers.
Whether workers are better off is a trickier question than it first appears. Do we measure just pay or all income, which includes benefits and after-tax transfers? If one person gets a raise and a second earns more because they changed jobs or acquired new skills, is that the same thing or two different things? Should we adjust for the population becoming older and more educated, or not? Should we adjust for sectoral shifts as more workers take up service jobs, which pay more on average than manufacturing?
To minimize these compositional effects, Tedeschi created a low wage index (LWI) to hold sex, age, industry, occupation, and education fixed over time. He found that since 1979, bottom-quartile wages have been stagnant with two exceptions. There have been two sustained periods of upward pressure on bottom-quartile wages, once during the dot com boom of 1997-2007 and again from 2014 until the present, when the wage index grew 25% over ten years.
Tedeschi’s index shows that low-wage workers have benefited from wage tailwinds in recent years. Historically, this is rare. In most eras, workers can increase their pay by climbing career ladders or upgrading their skills, but labor markets do not usually put ambient upward pressure on the wages of low-income workers.
Why did labor markets tighten so much during these years? Economic, demographic, and policy-related factors interacted. Both periods followed economic recessions. Robust recoveries led to tighter labor markets as the economy expanded. Very low interest rates and fiscal deficits stimulated economic growth and increased demand for labor. The COVID-19 pandemic led many people to change jobs. Baby boomers began to retire in large numbers.
Income Inequality is Still High
The problem of income inequality has not gone away, even if it has improved a bit. Economists measure inequality using Gini coefficients. The Gini coefficient is a measure of income inequality within a population developed by the Italian statistician Corrado Gini. The coefficient ranges from 0 to 1. Zero represents perfect equality, meaning everyone has the same income and one represents perfect inequality, where one person has all the income and everyone else has none.
Mathematically, it ranks all individuals in a population from the poorest to the richest. The Gini coefficient measures the extent to which the distribution of income among individuals or households deviates from a perfectly equal distribution. Technically, it compares the area between the Lorenz curve (which shows the actual distribution of income) and the line of equality (which represents equal income distribution).
Here are Gini coefficients for the United States over time.
Here are Gini coefficients for four kinds of countries. Not surprisingly, Nordic (the average of Sweden, Finland, Denmark, and Norway) have the lowest Gini. Other OECD countries (Canada, Switzerland, the UK, Germany, France, and Spain) are in the middle, and China, and the United States compete for the highest Gini.


